Data Visualization
Through research we gather a lot of data that is essential for our designs. It even justifies the decisions we make and the strategies that the designs follow. Because of this, it is important to know how to represent the data and successfully transmit the stories we want to tell.
Infographics
Infographics are meant to visually transmit many different layers of information. They tend to carry out a macro message composed of more micro and specific data.
Diagramming
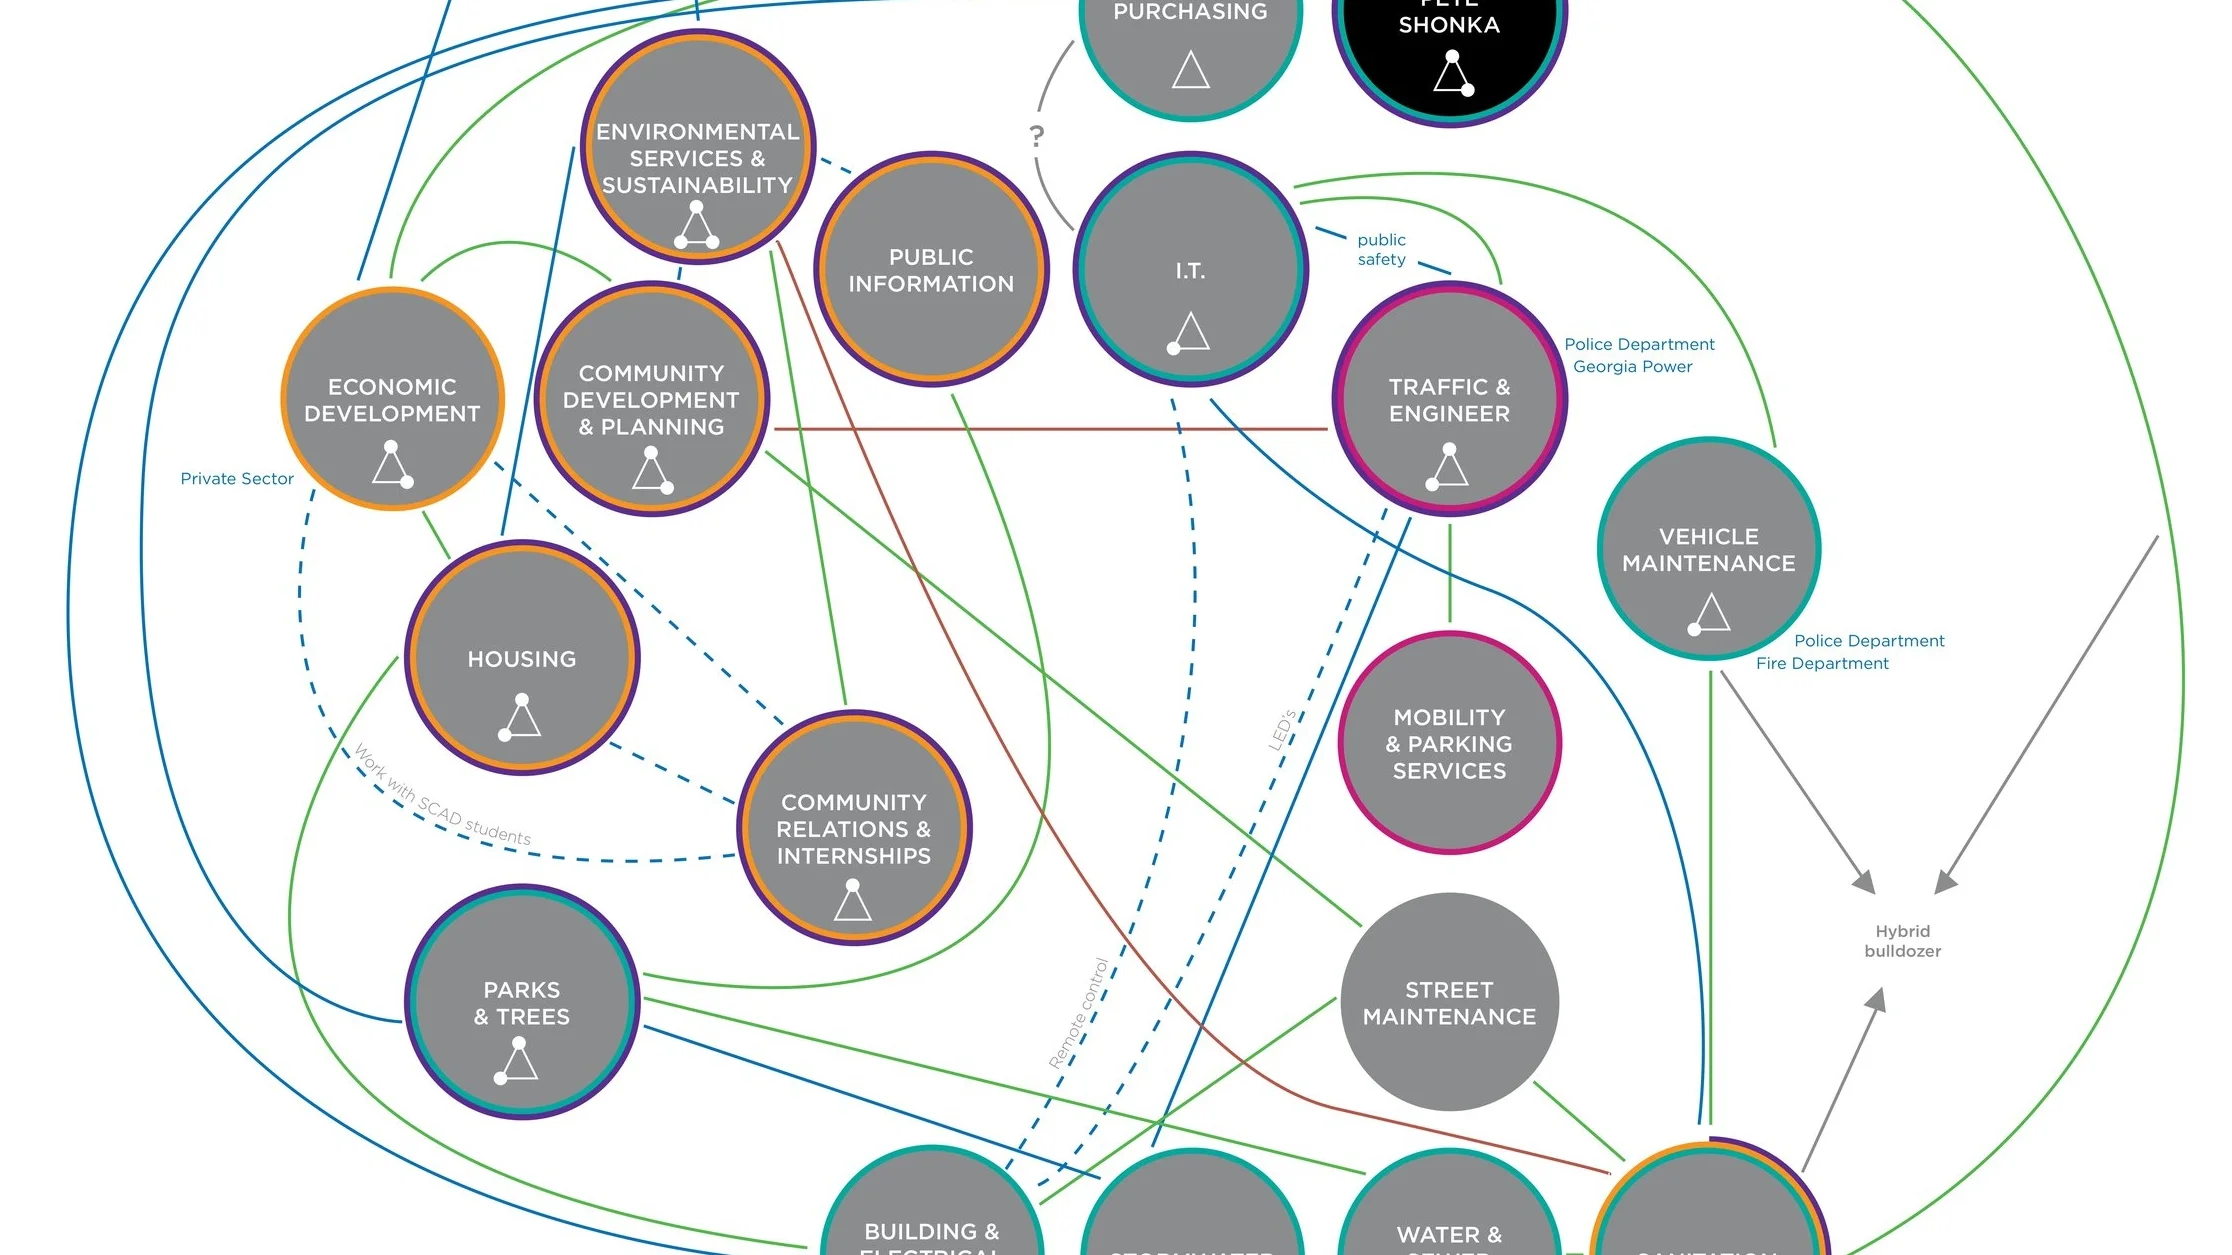
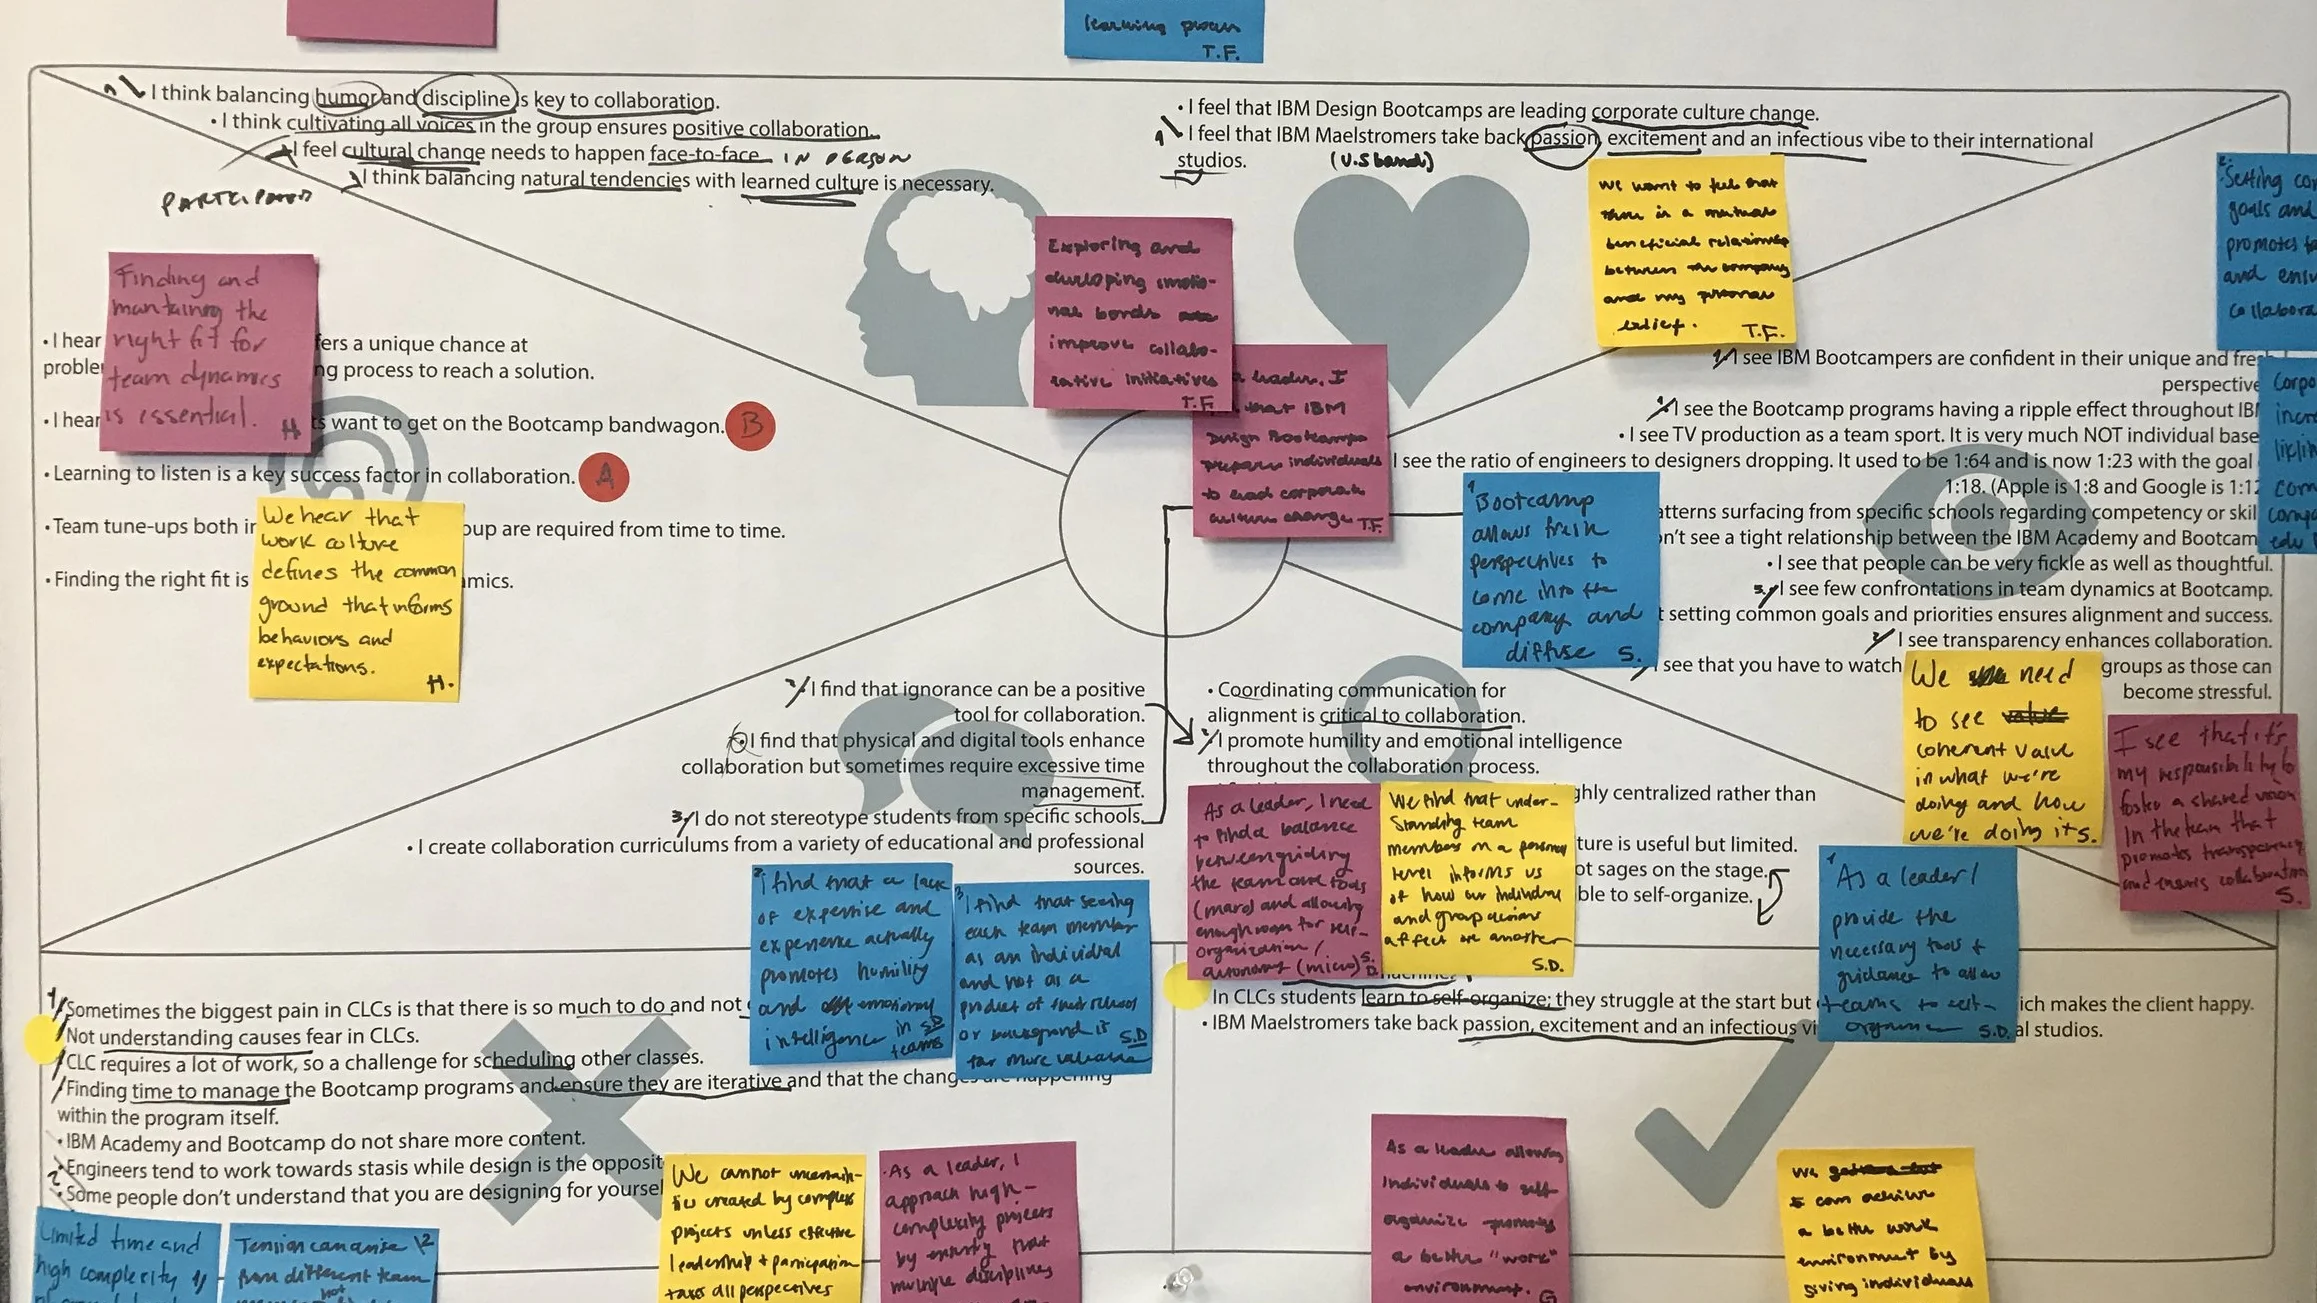
Different information requires different forms of representation. The more information we have, the more complex it is to visually express it, but also the more important it is. Diagrams help us translate complicated data into easy to understand relationships.
Library User Experience Toolkit: Process timeline
Sustainable Practices in Design: System map
Visual Rhetoric
Images can help transmit emotions that can’t really be represented literally. This can be a powerful component for storytelling that allows the designer to communicate perceptions visually. In the case of scenario planning, they aid in representing the emotions without being literal or misguiding the attention from the scenario plot.
The Future of LEGO: Five Year Scenario Visual Rhetoric
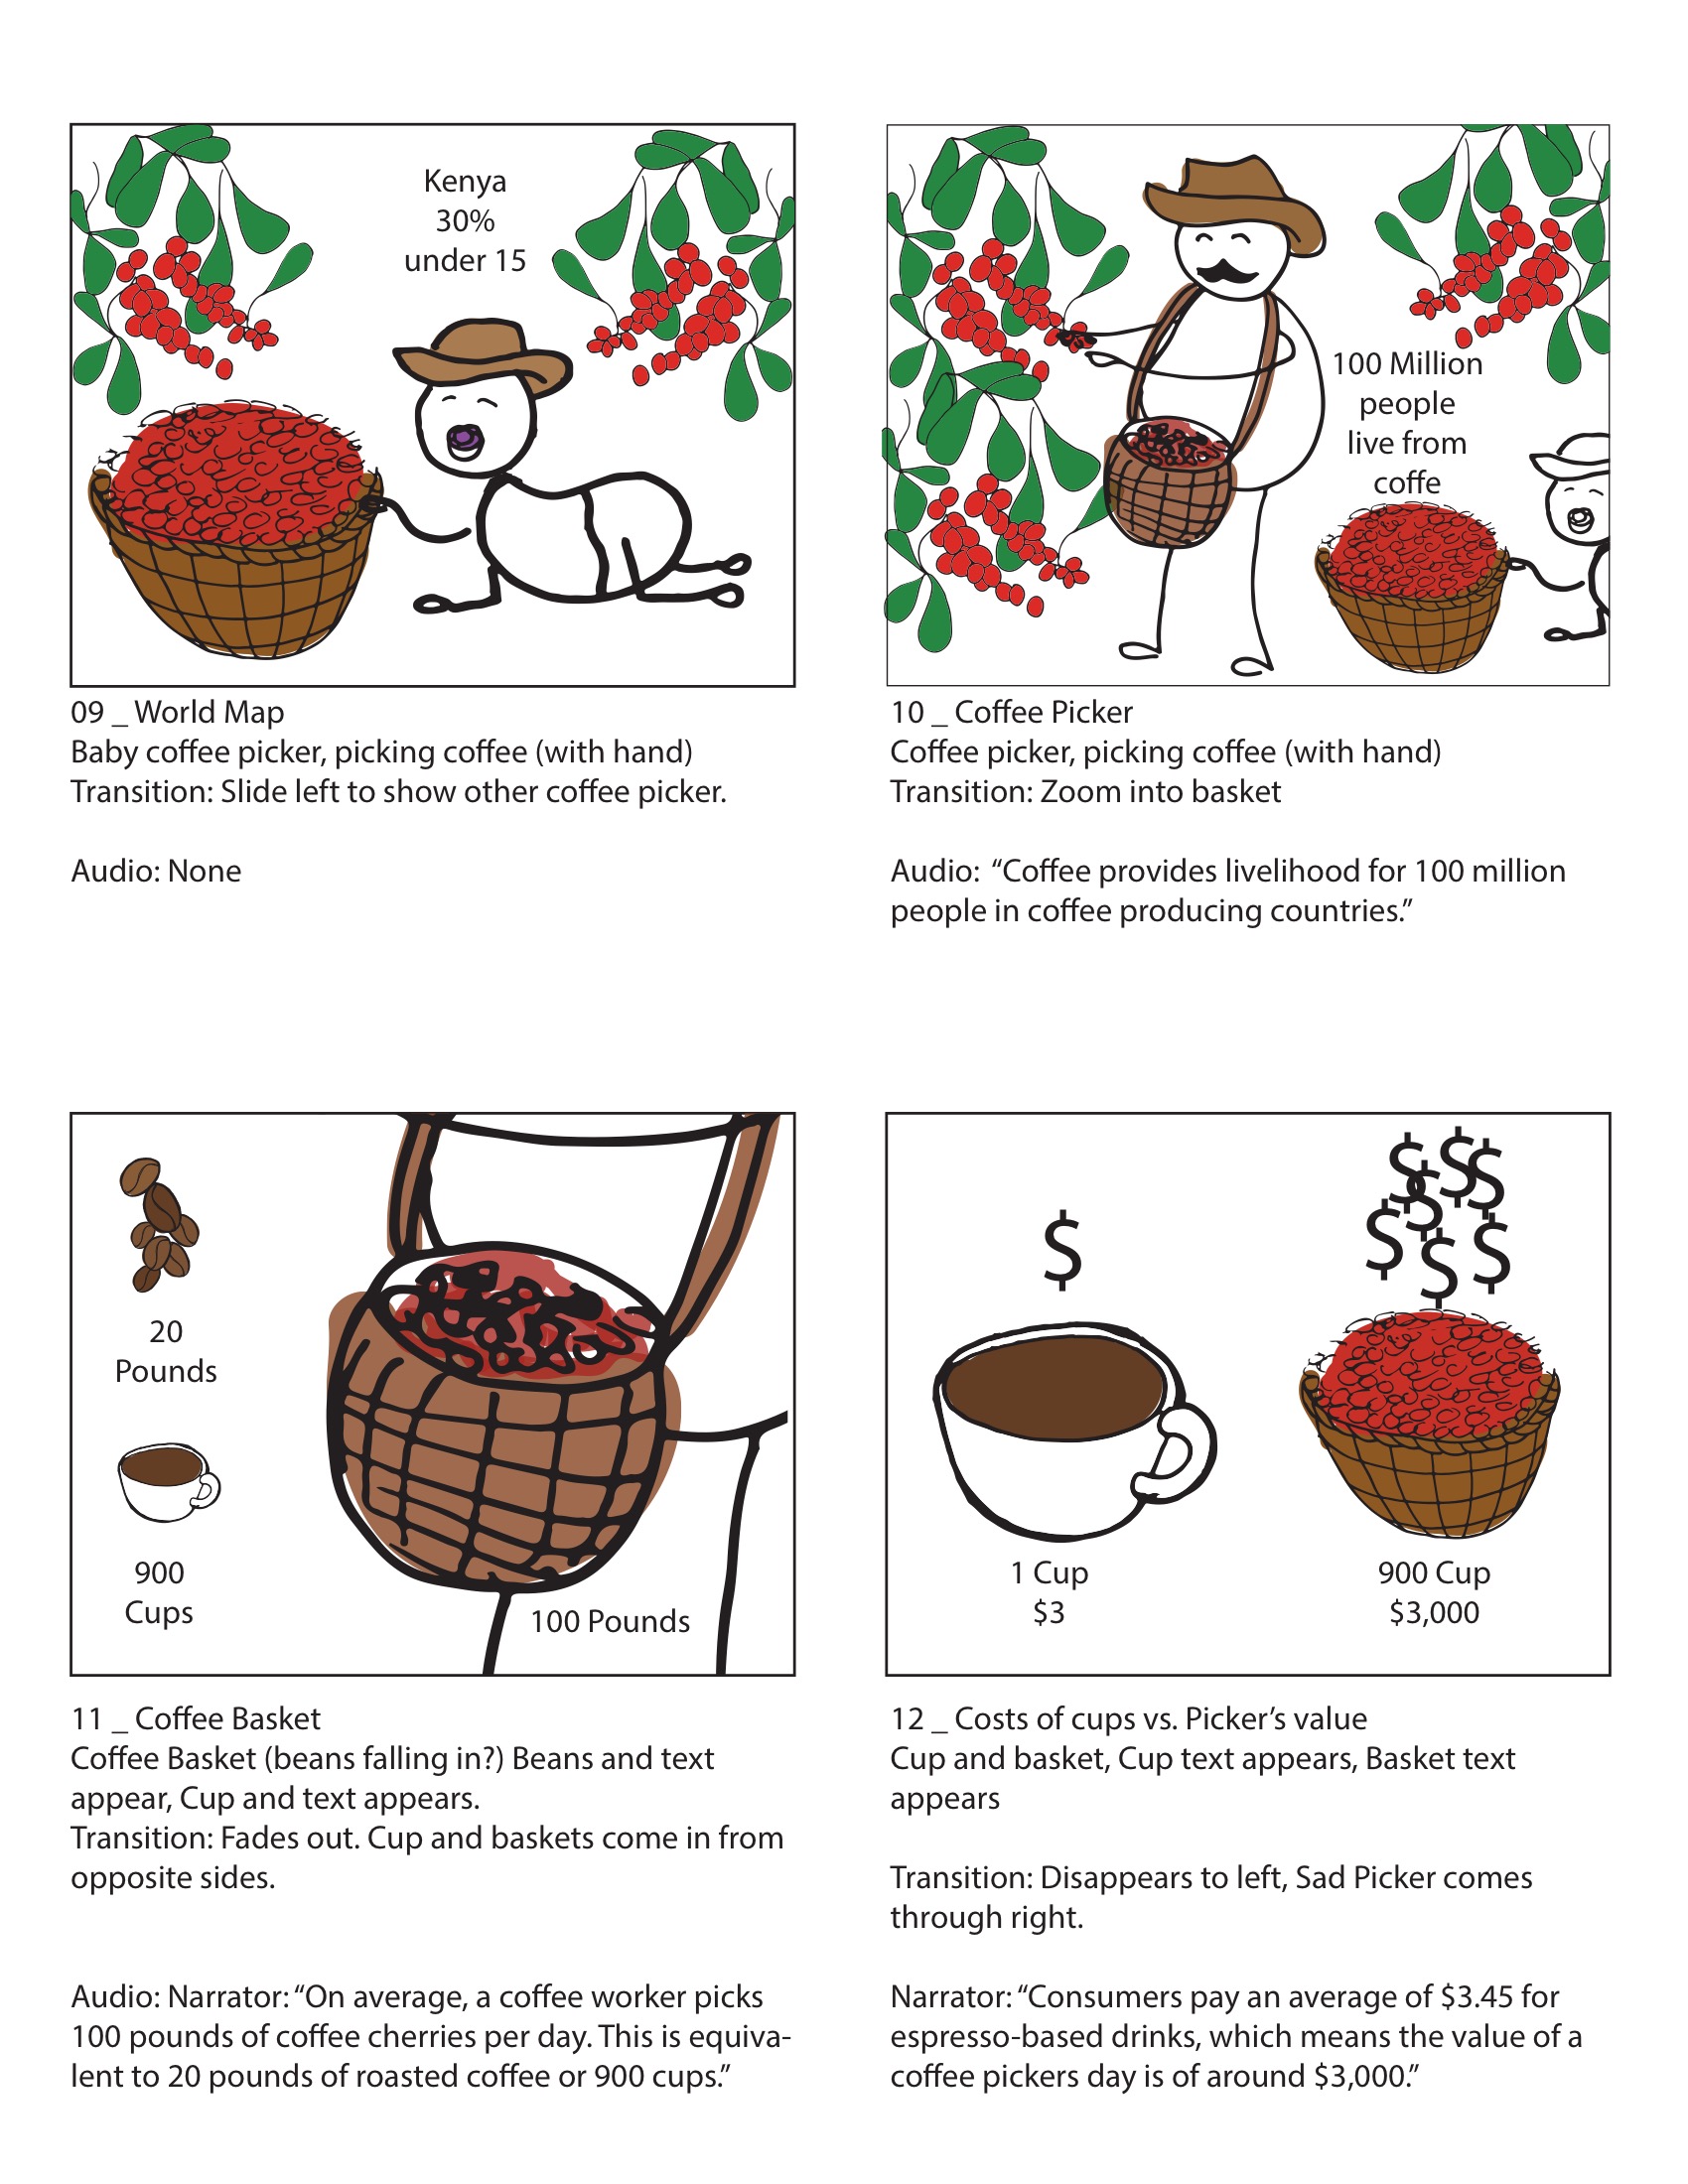
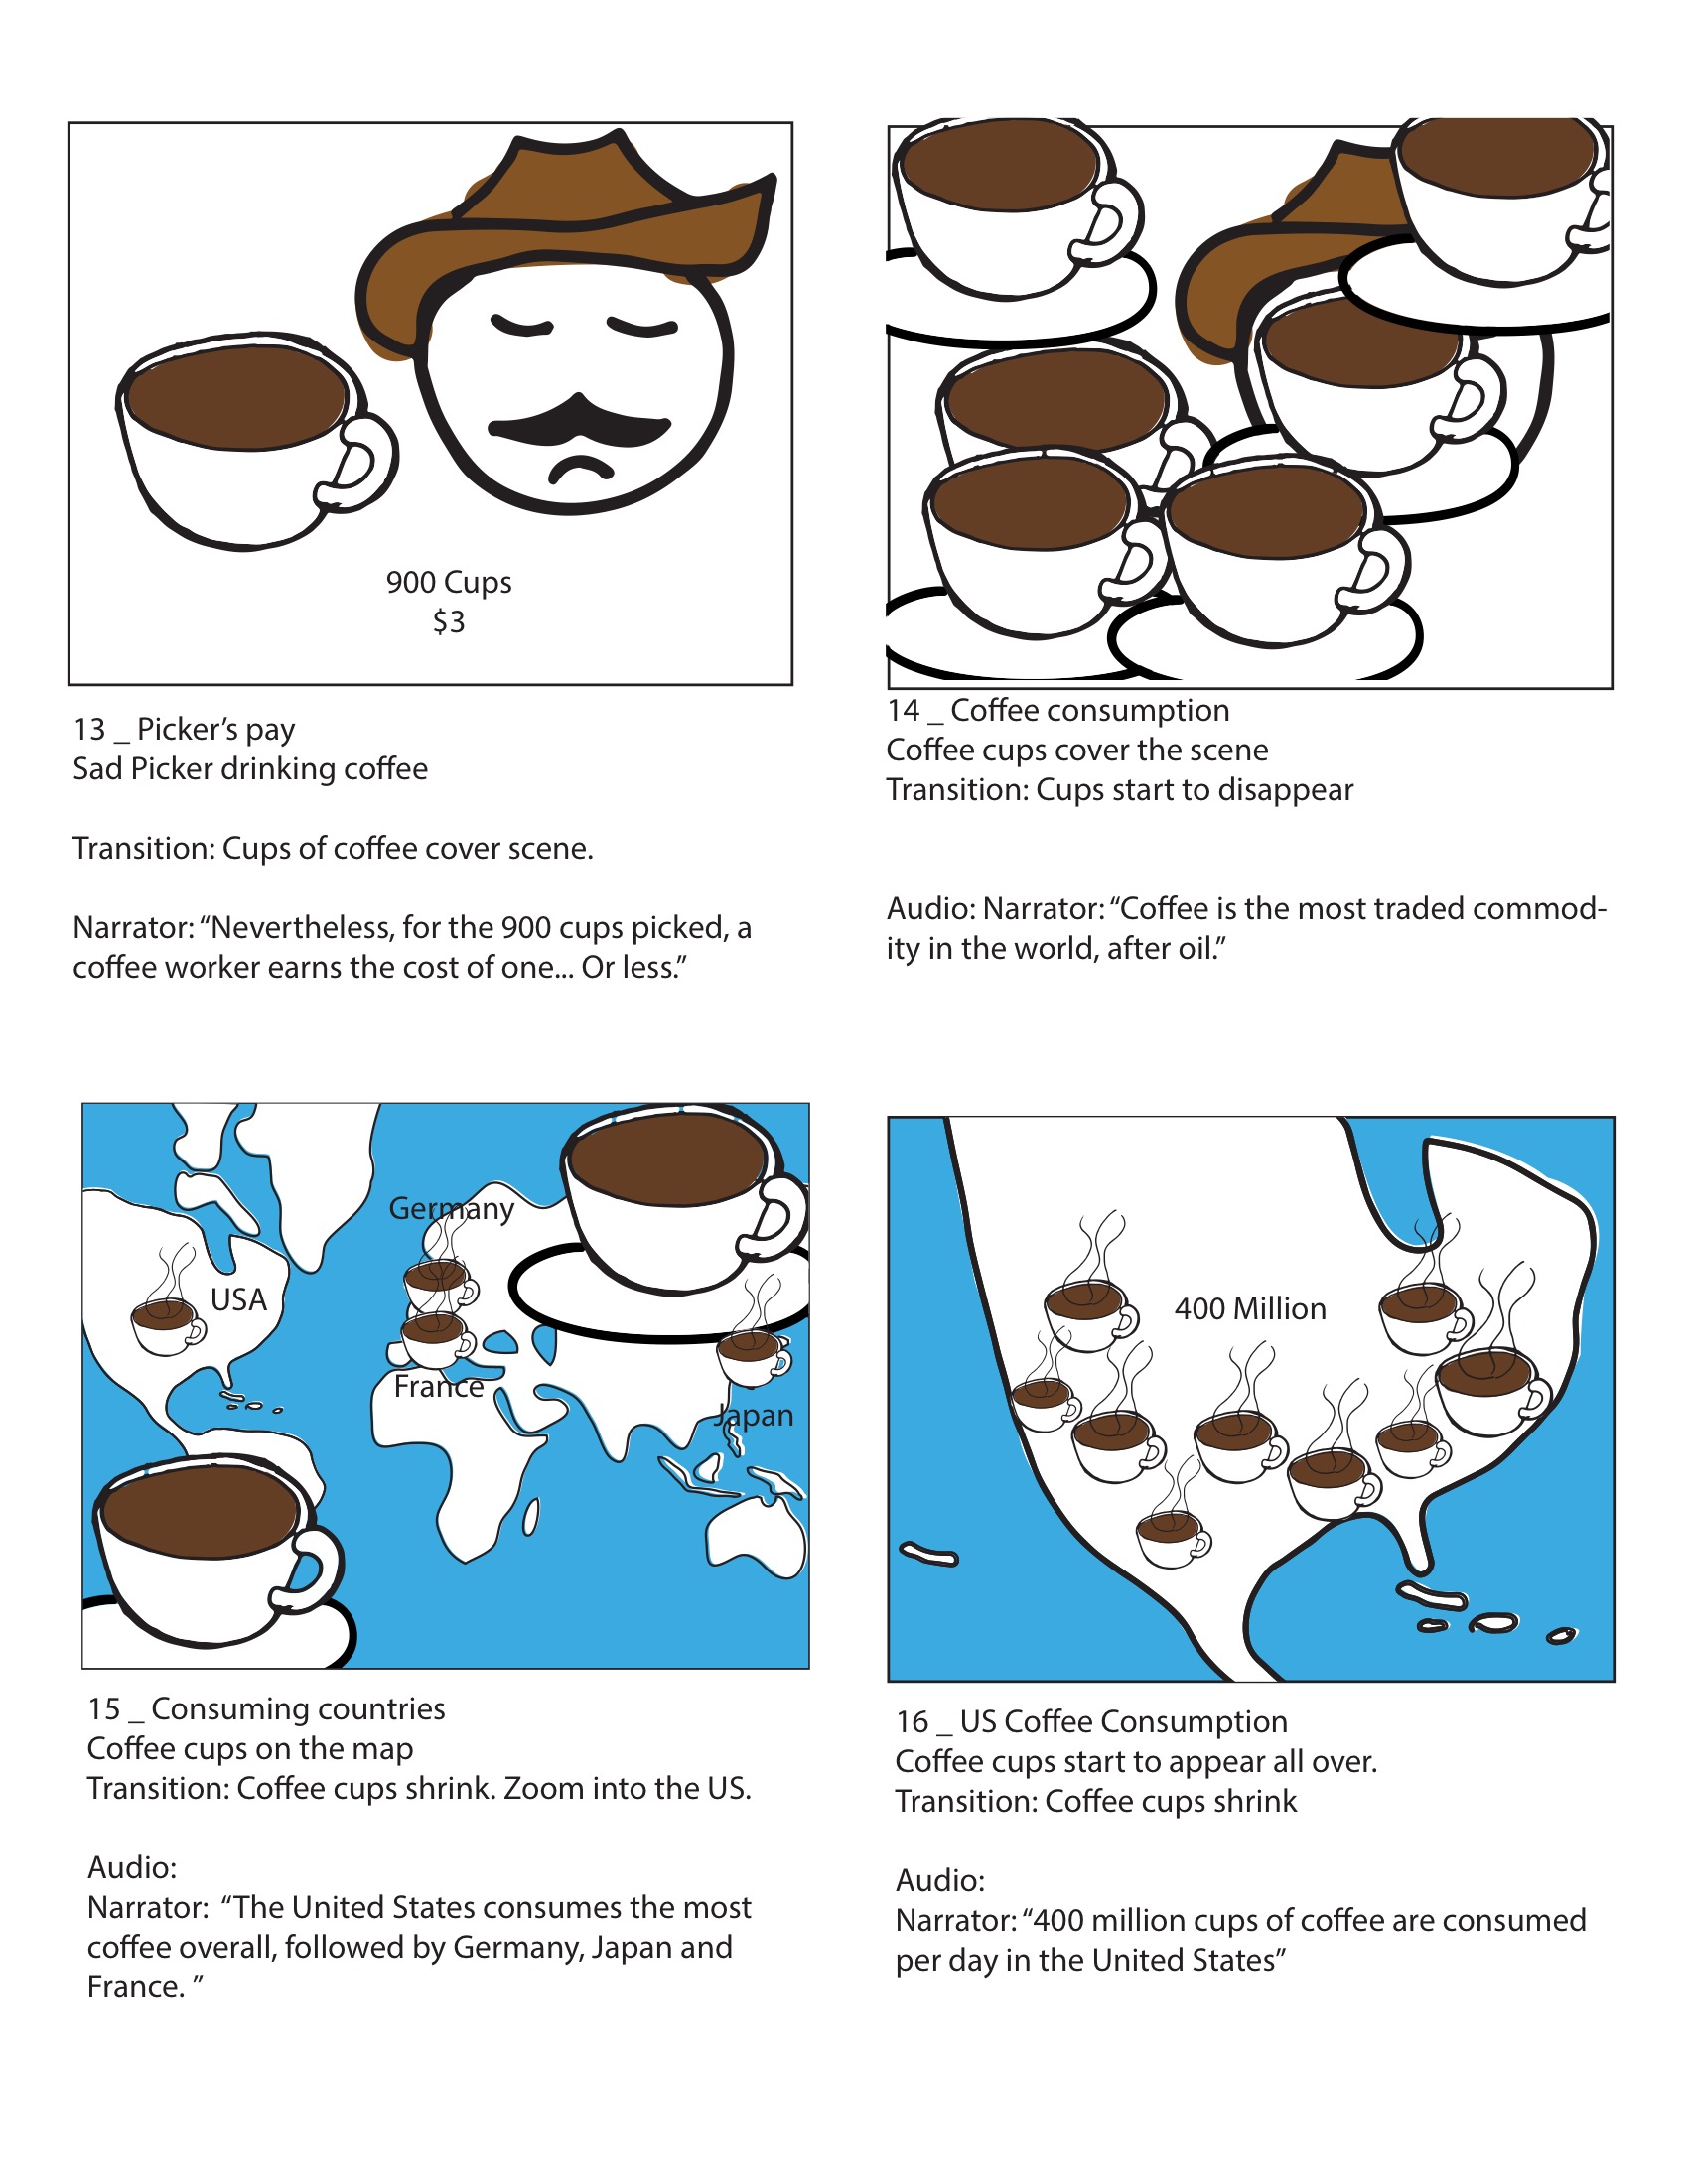
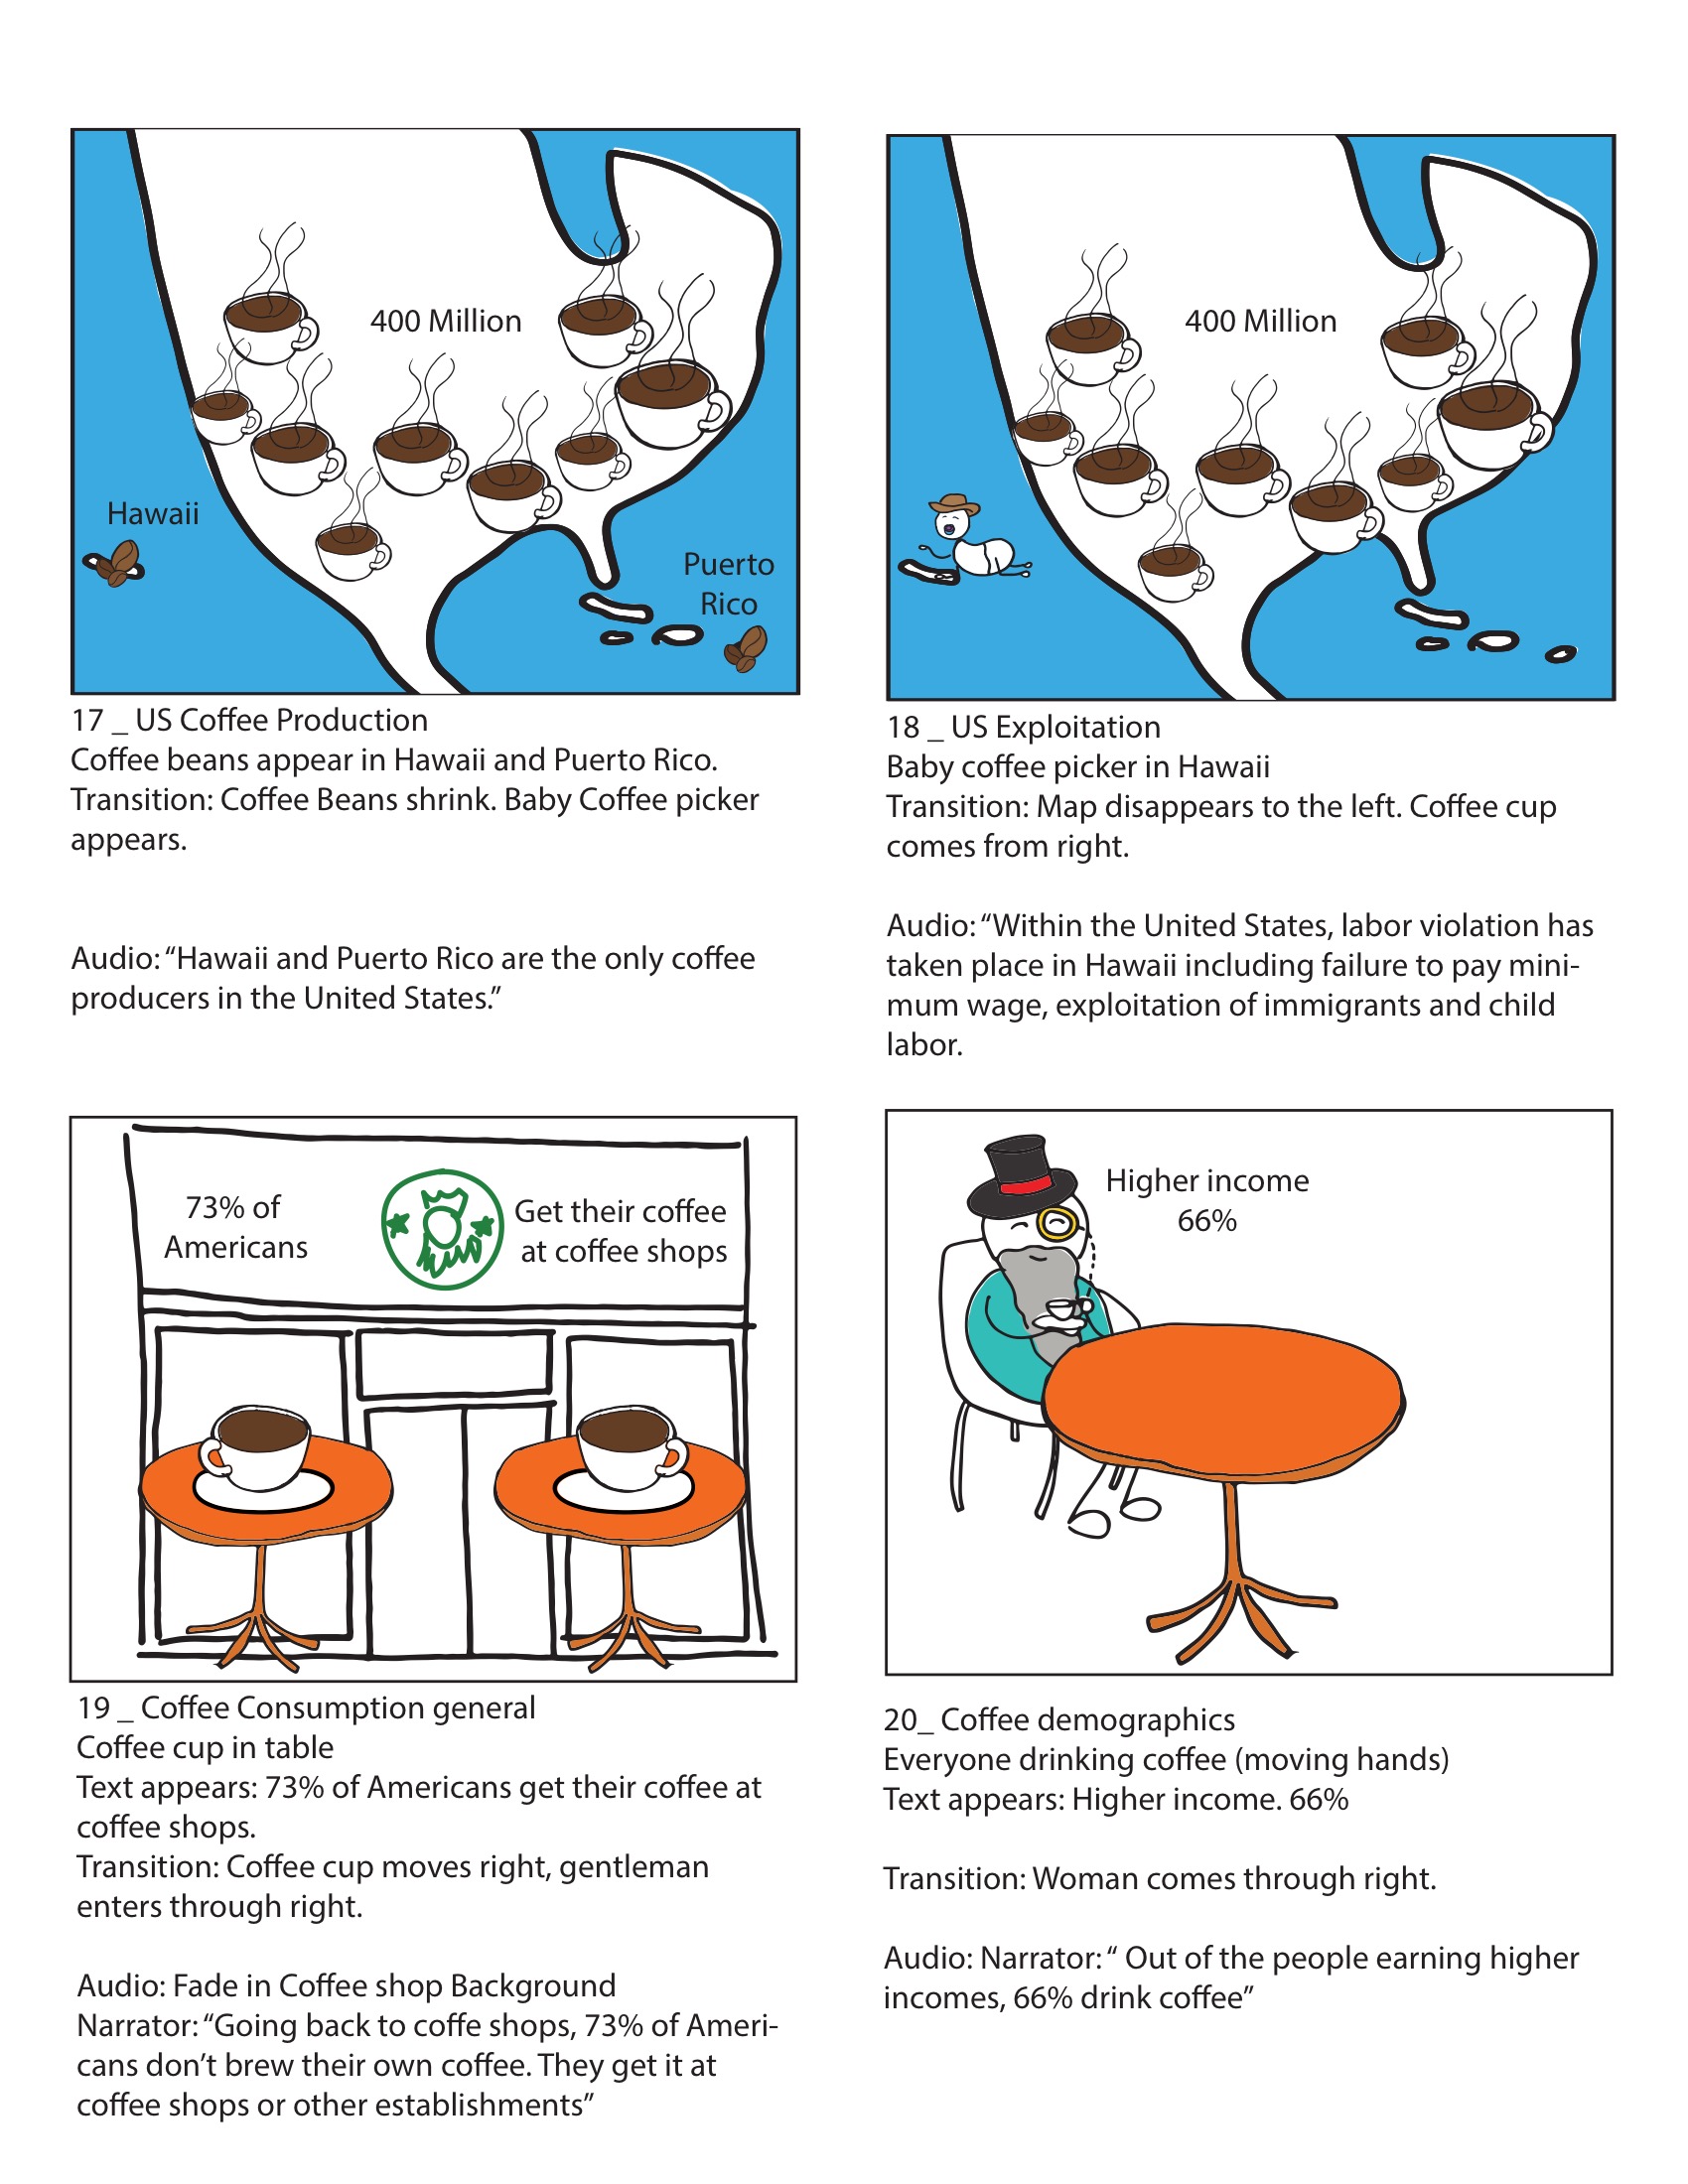
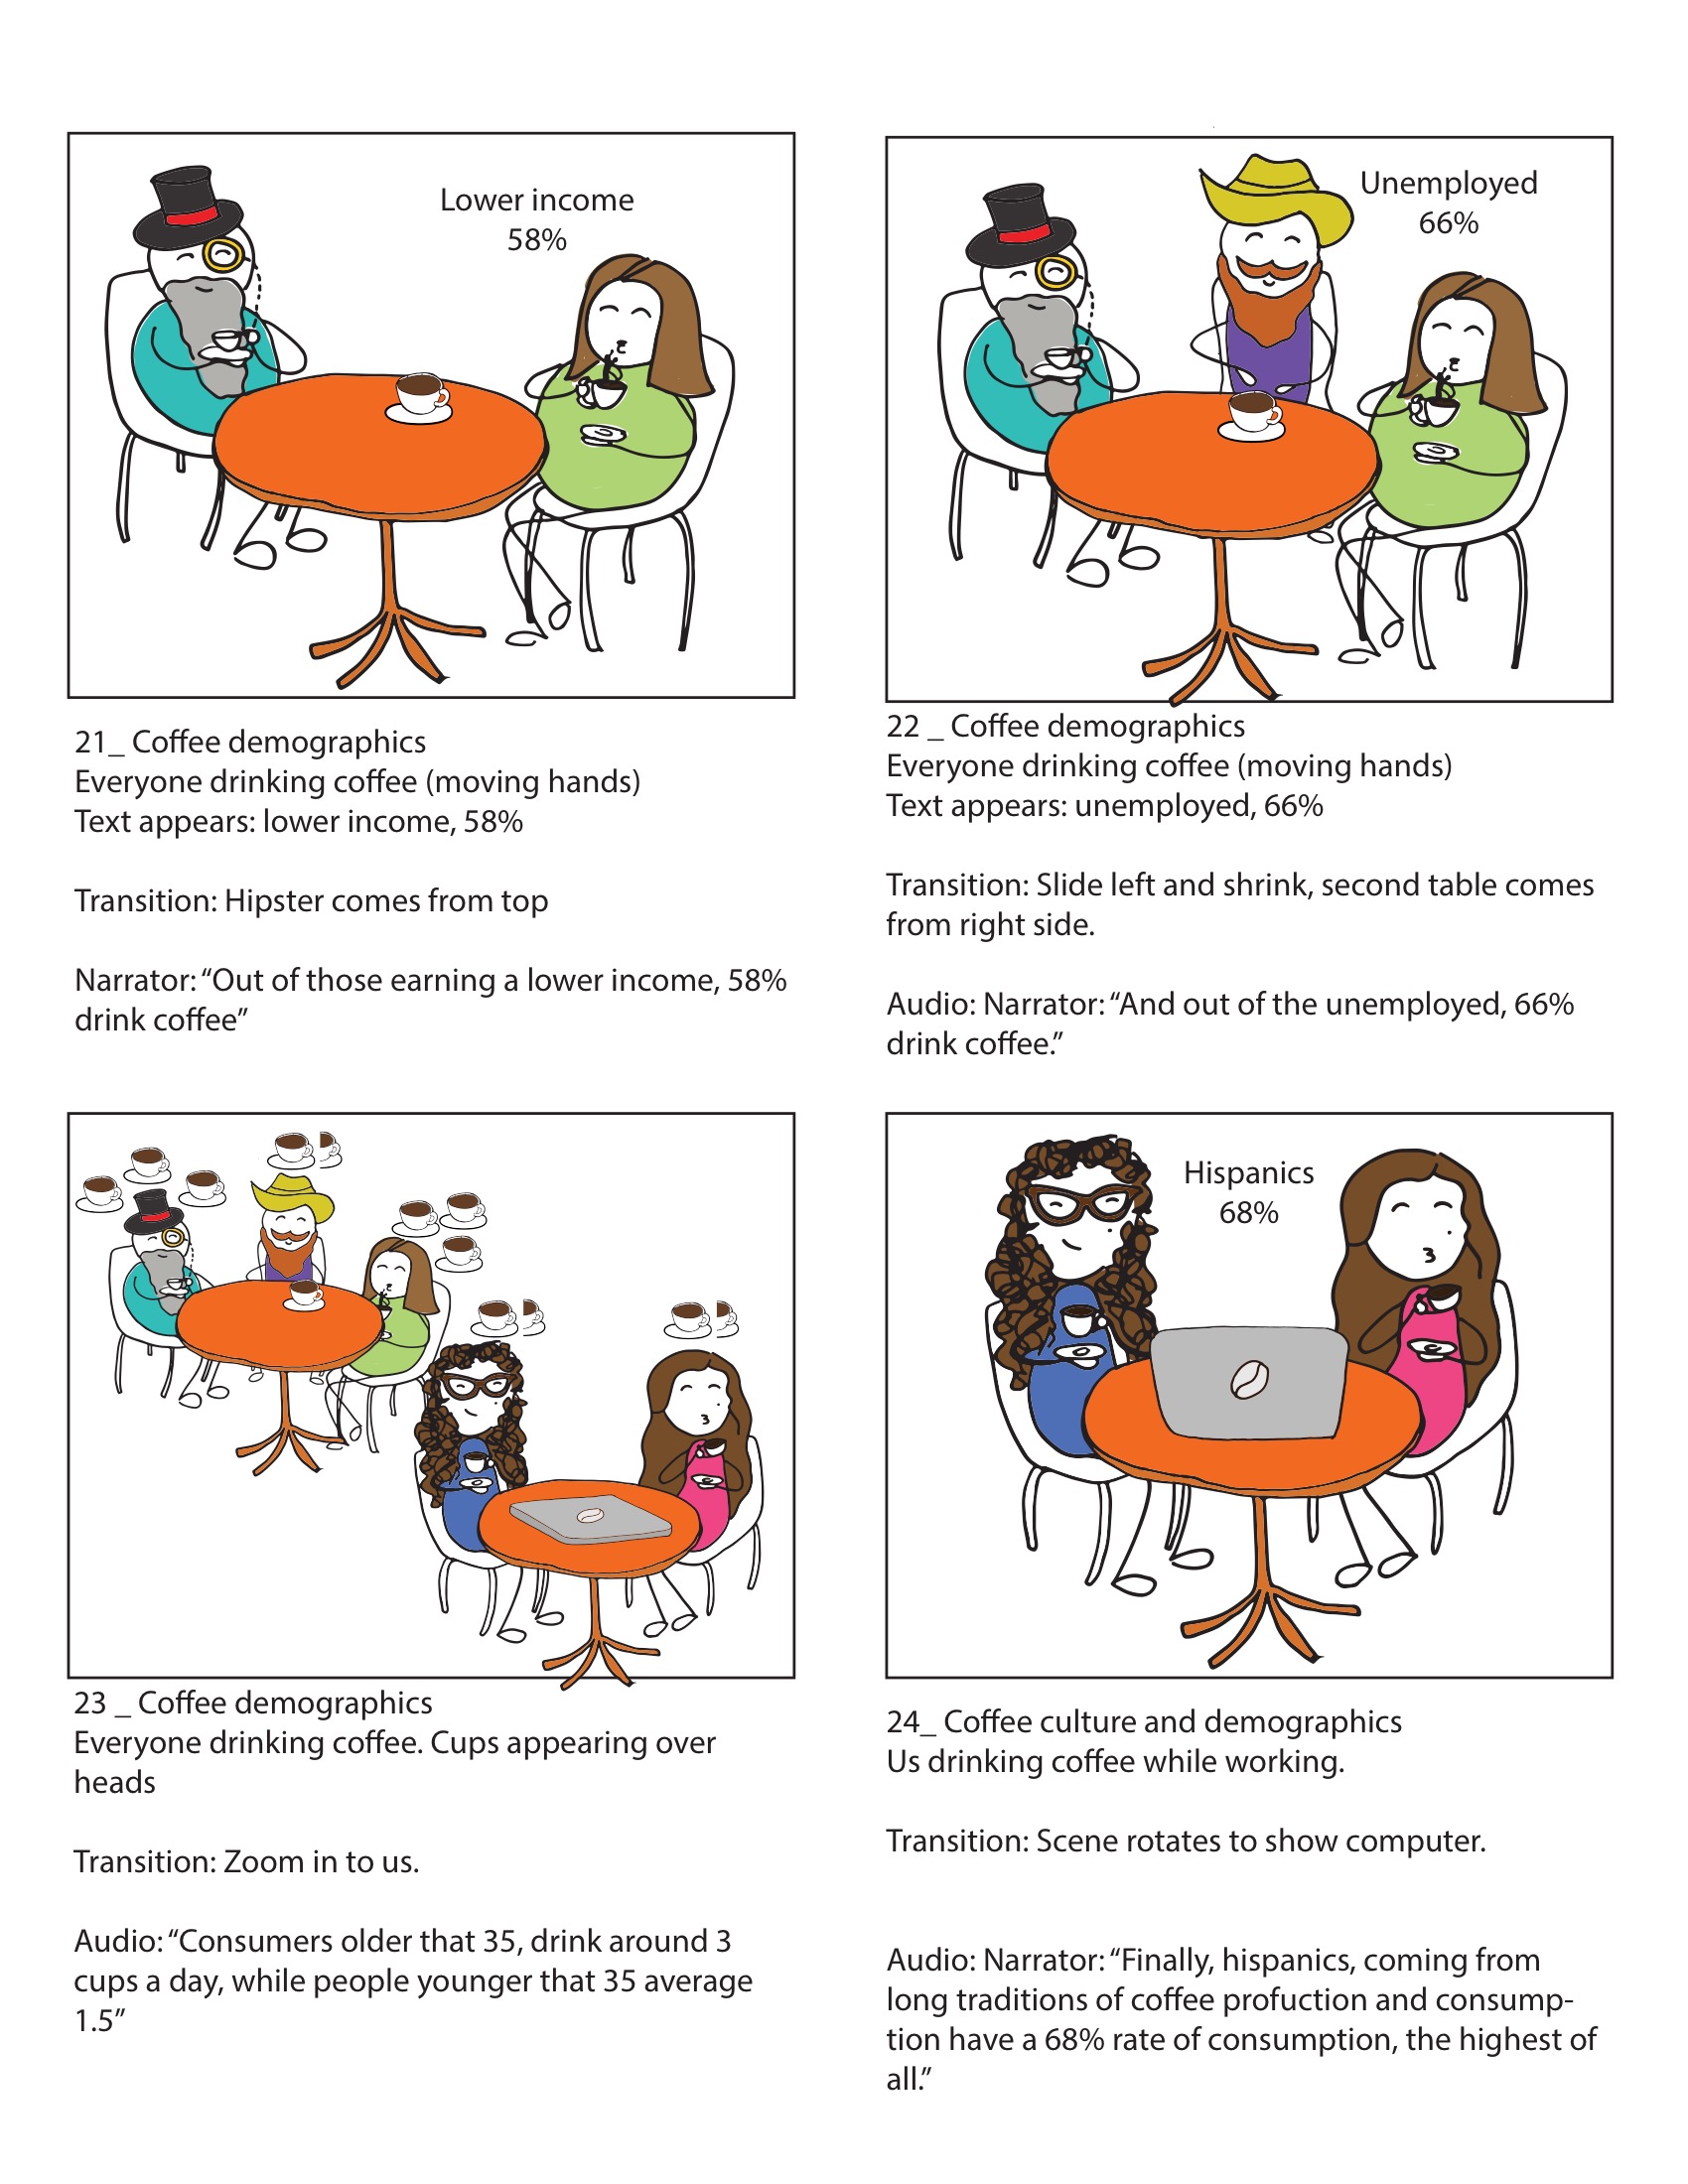
Video
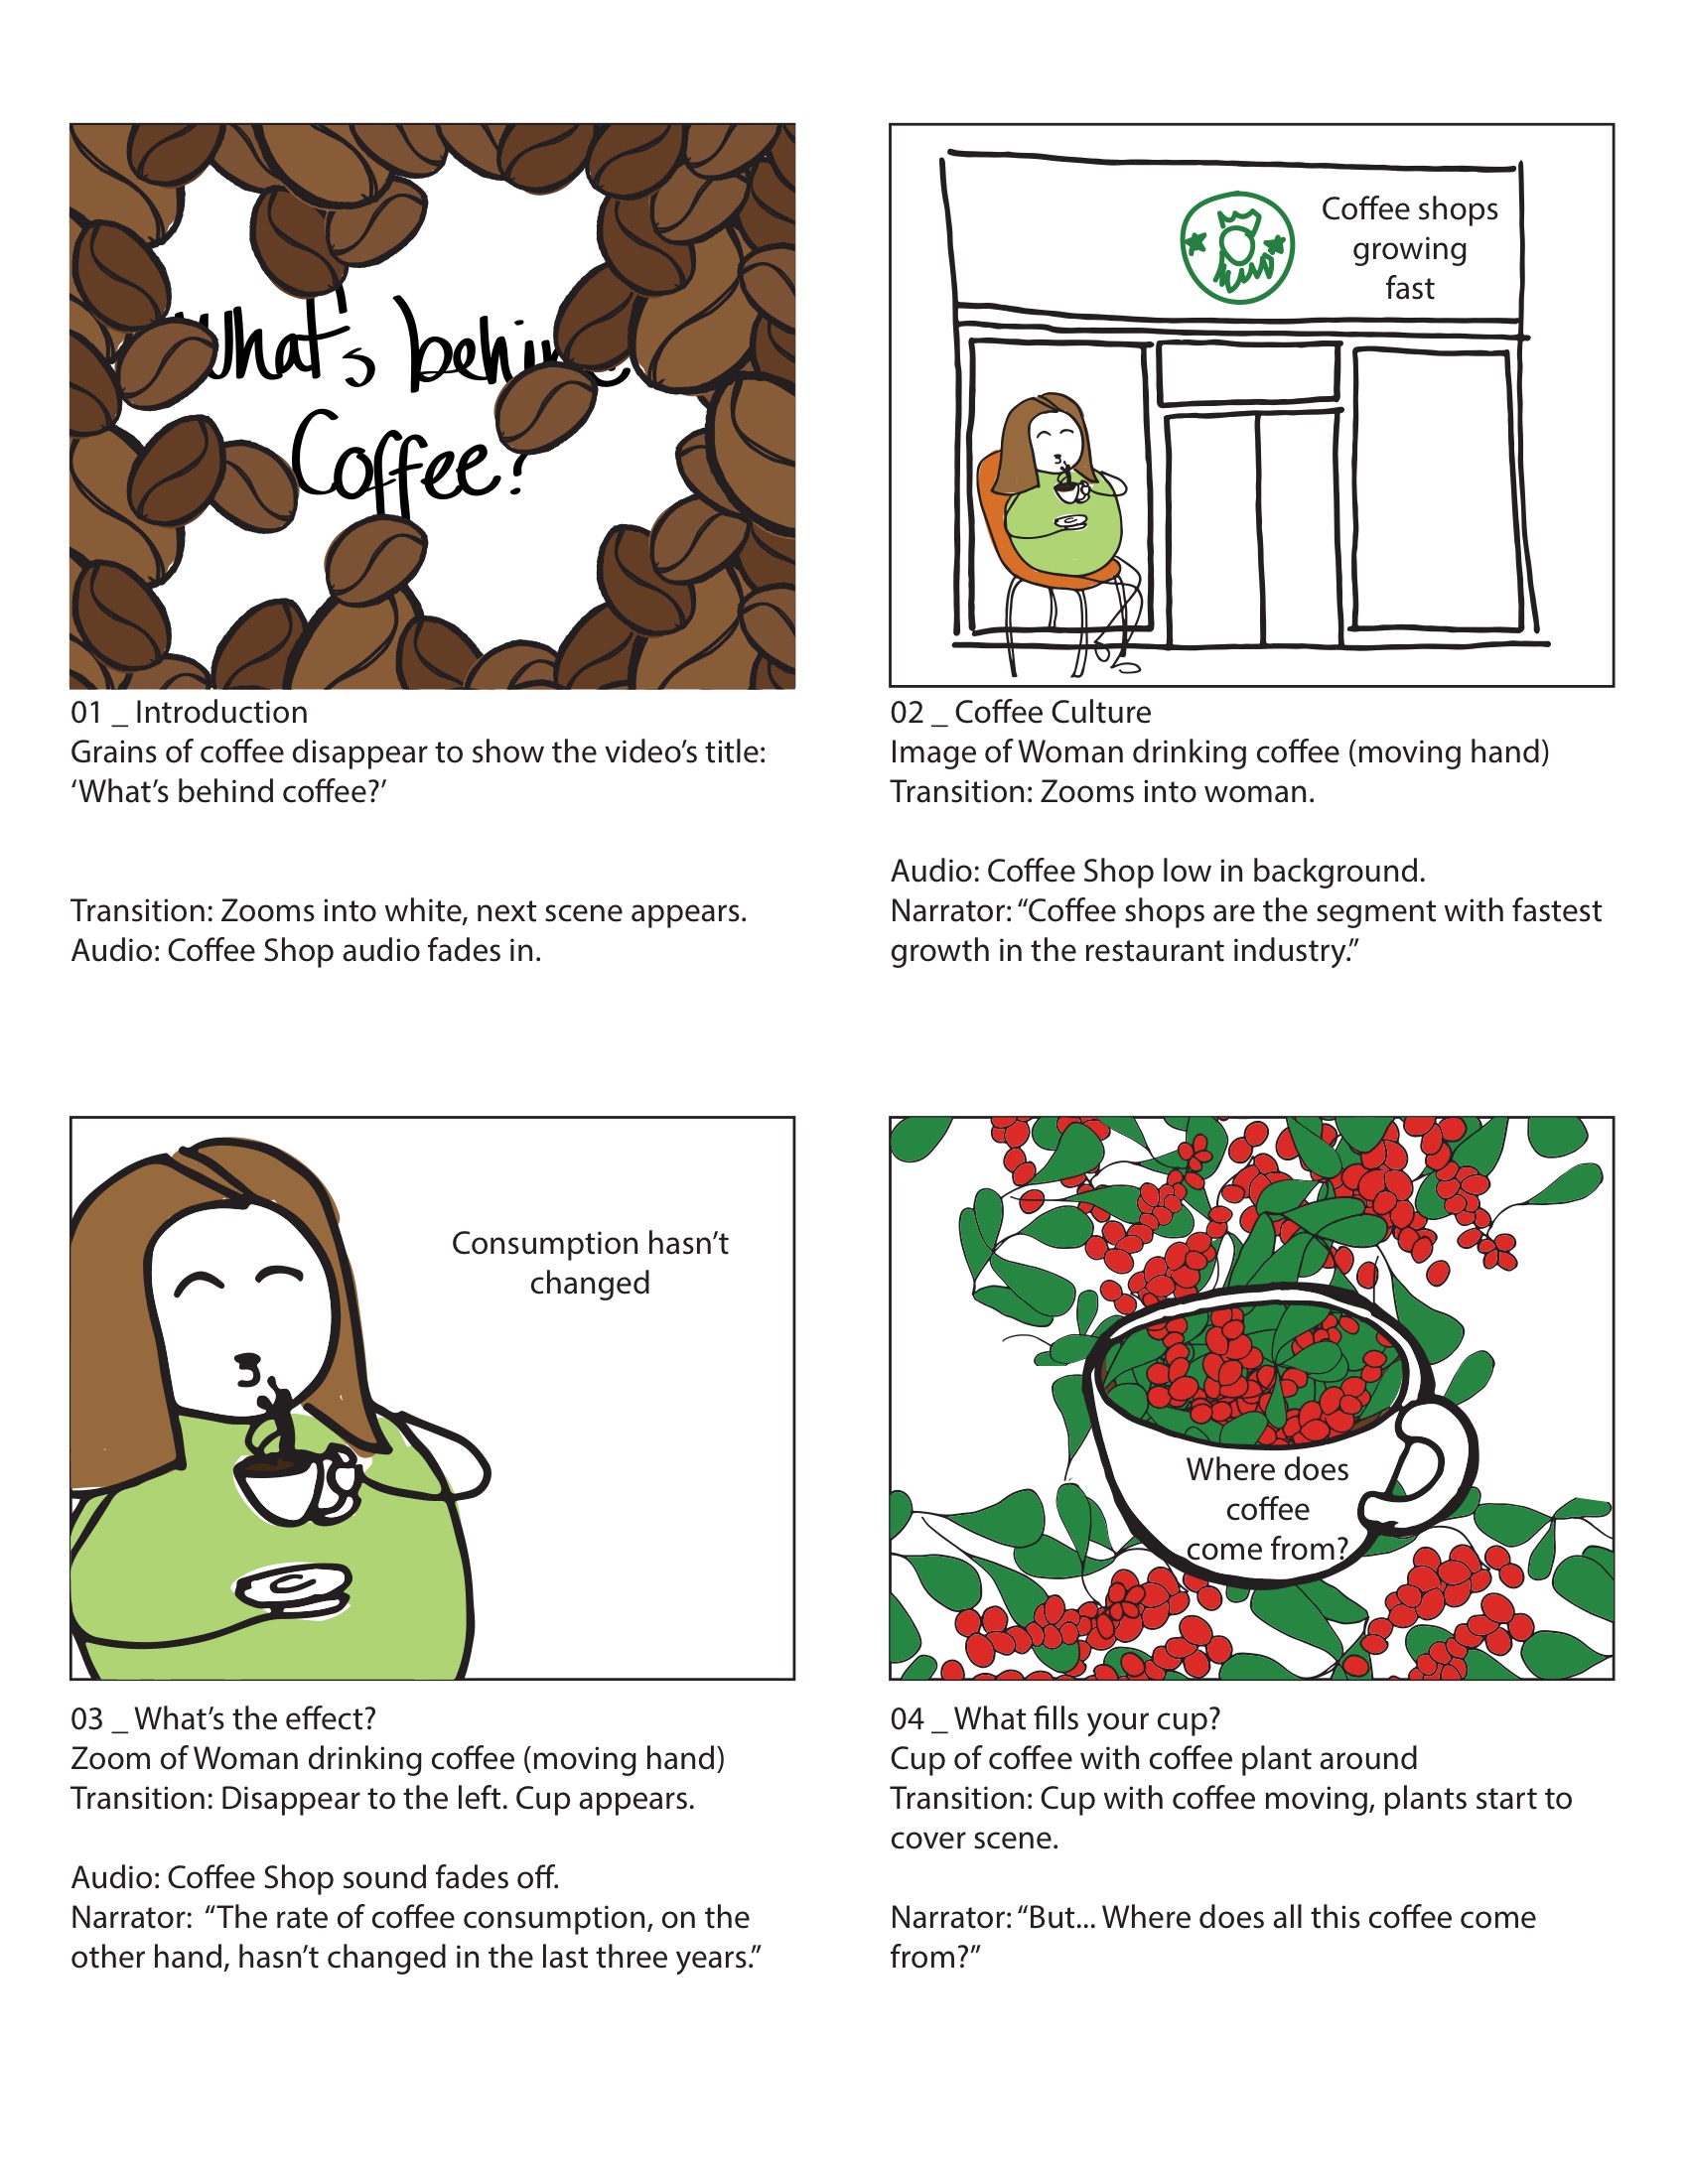
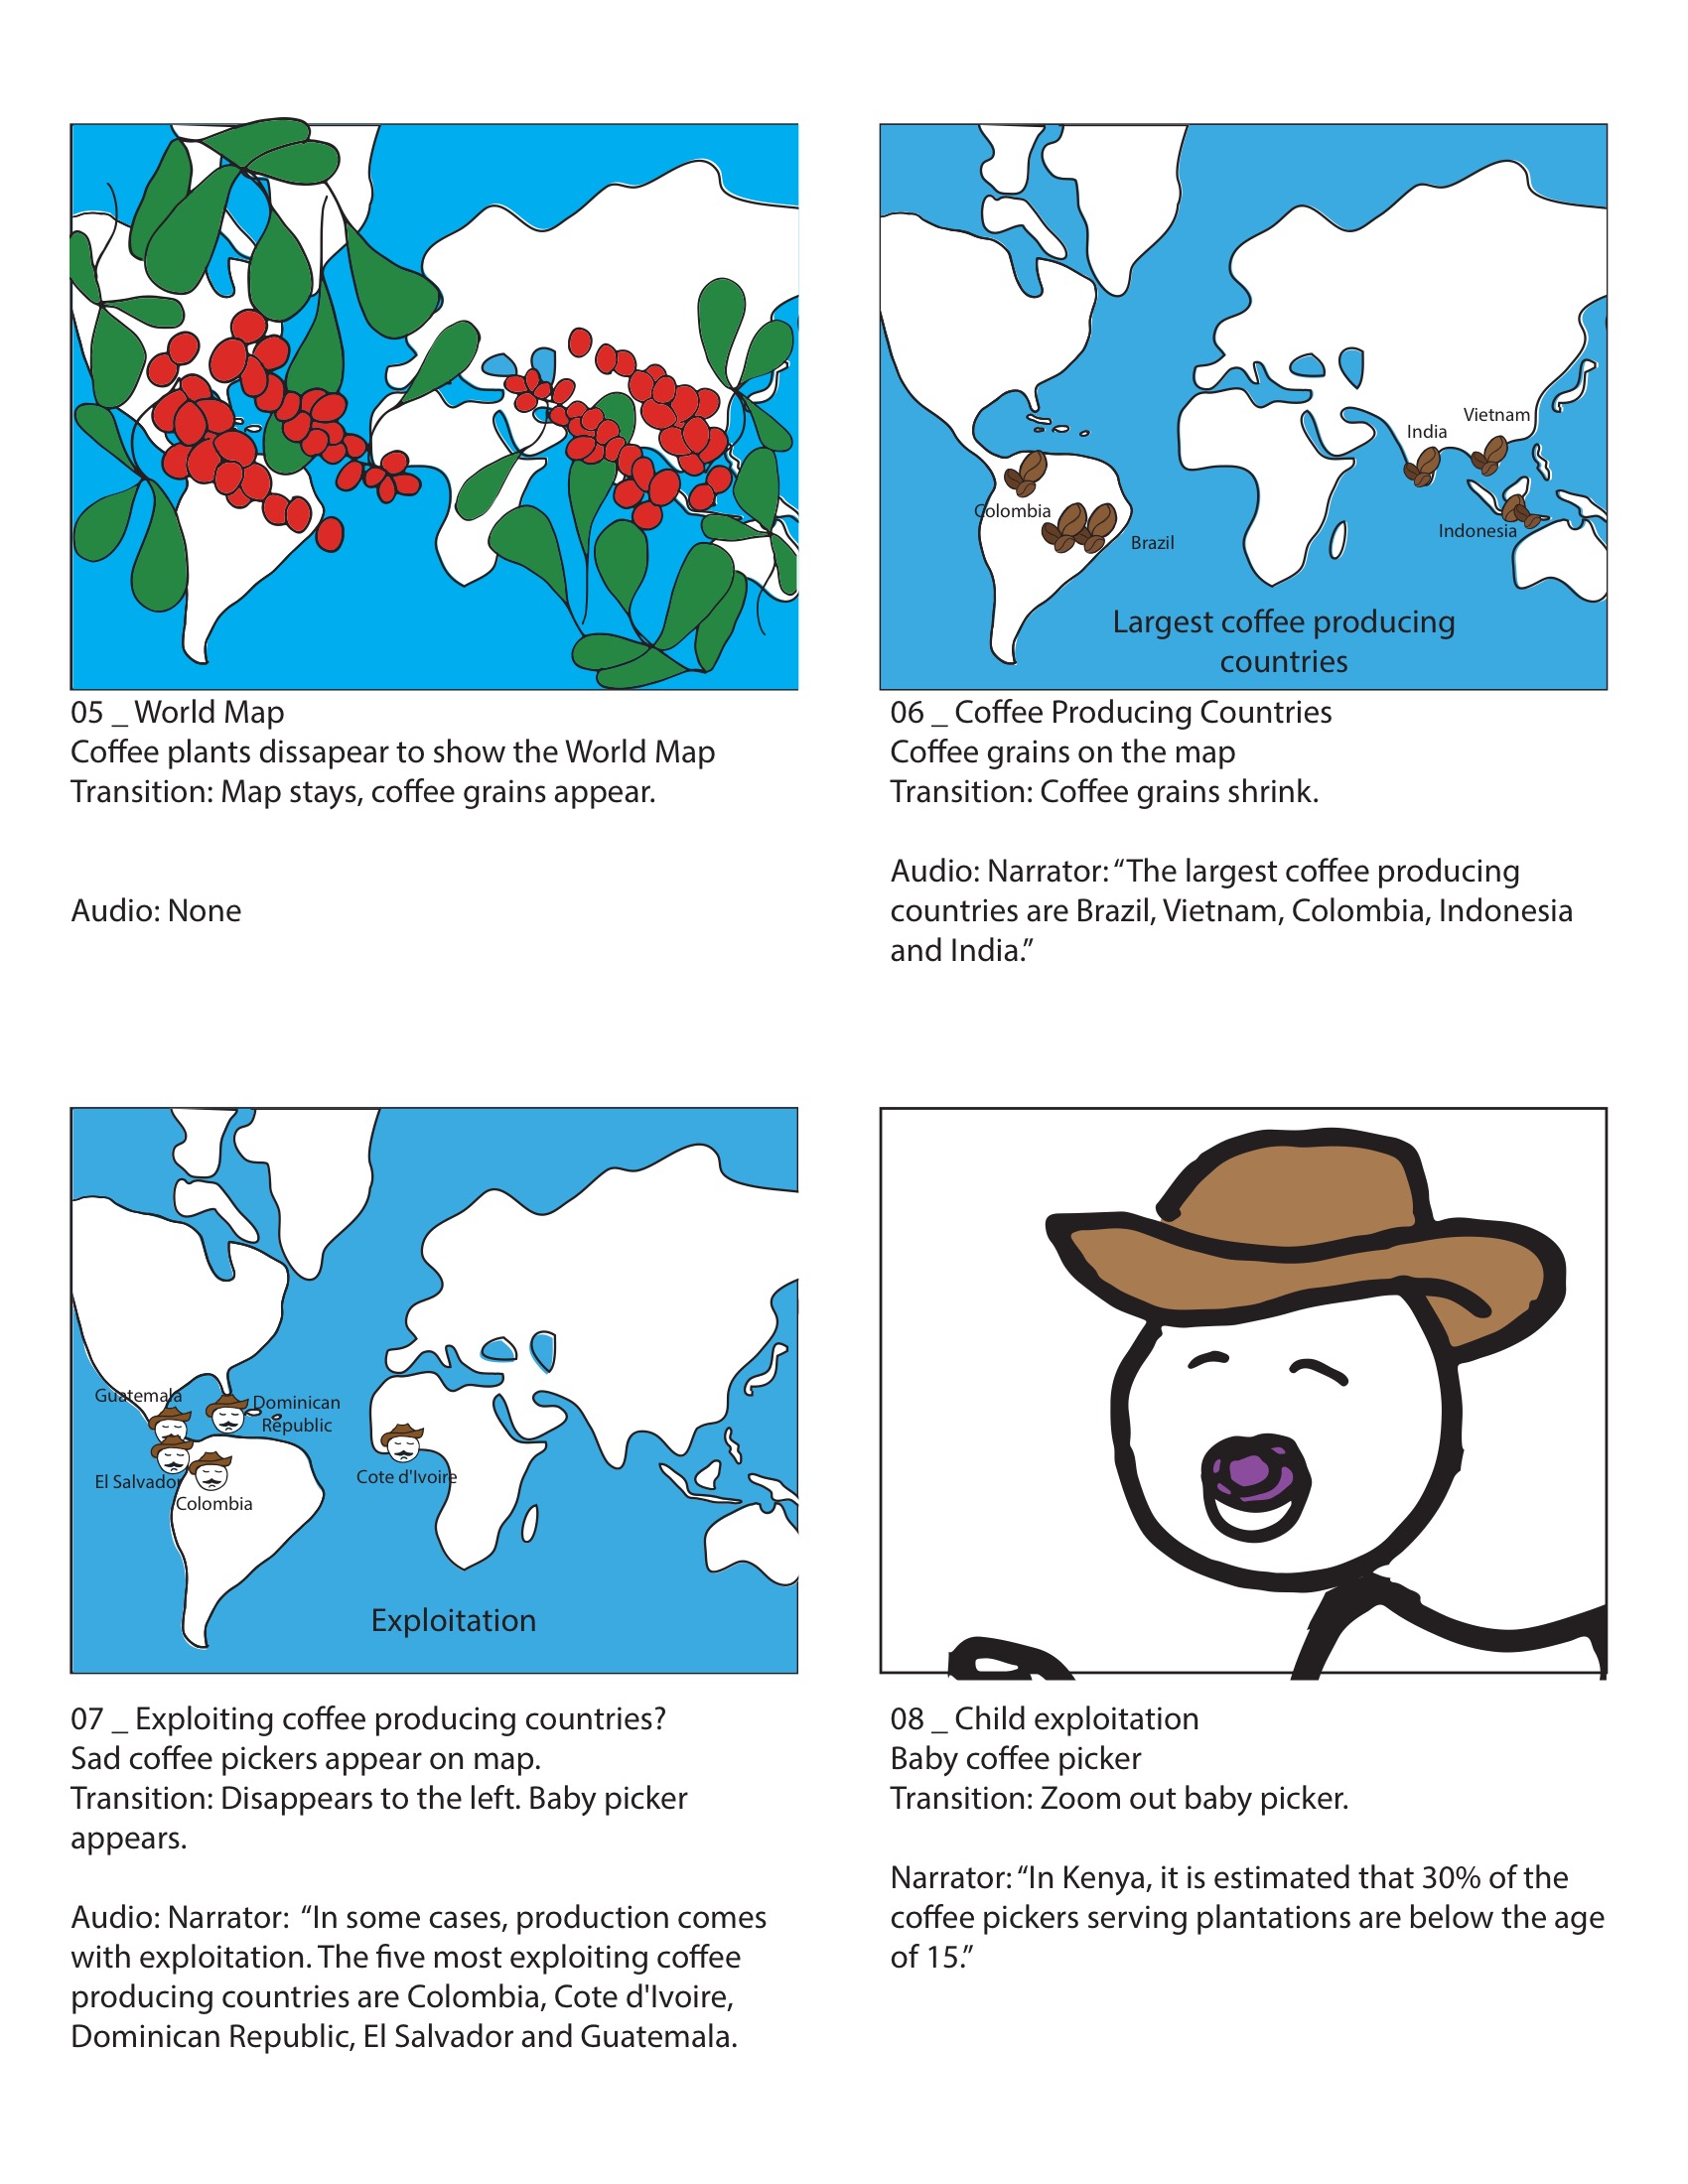
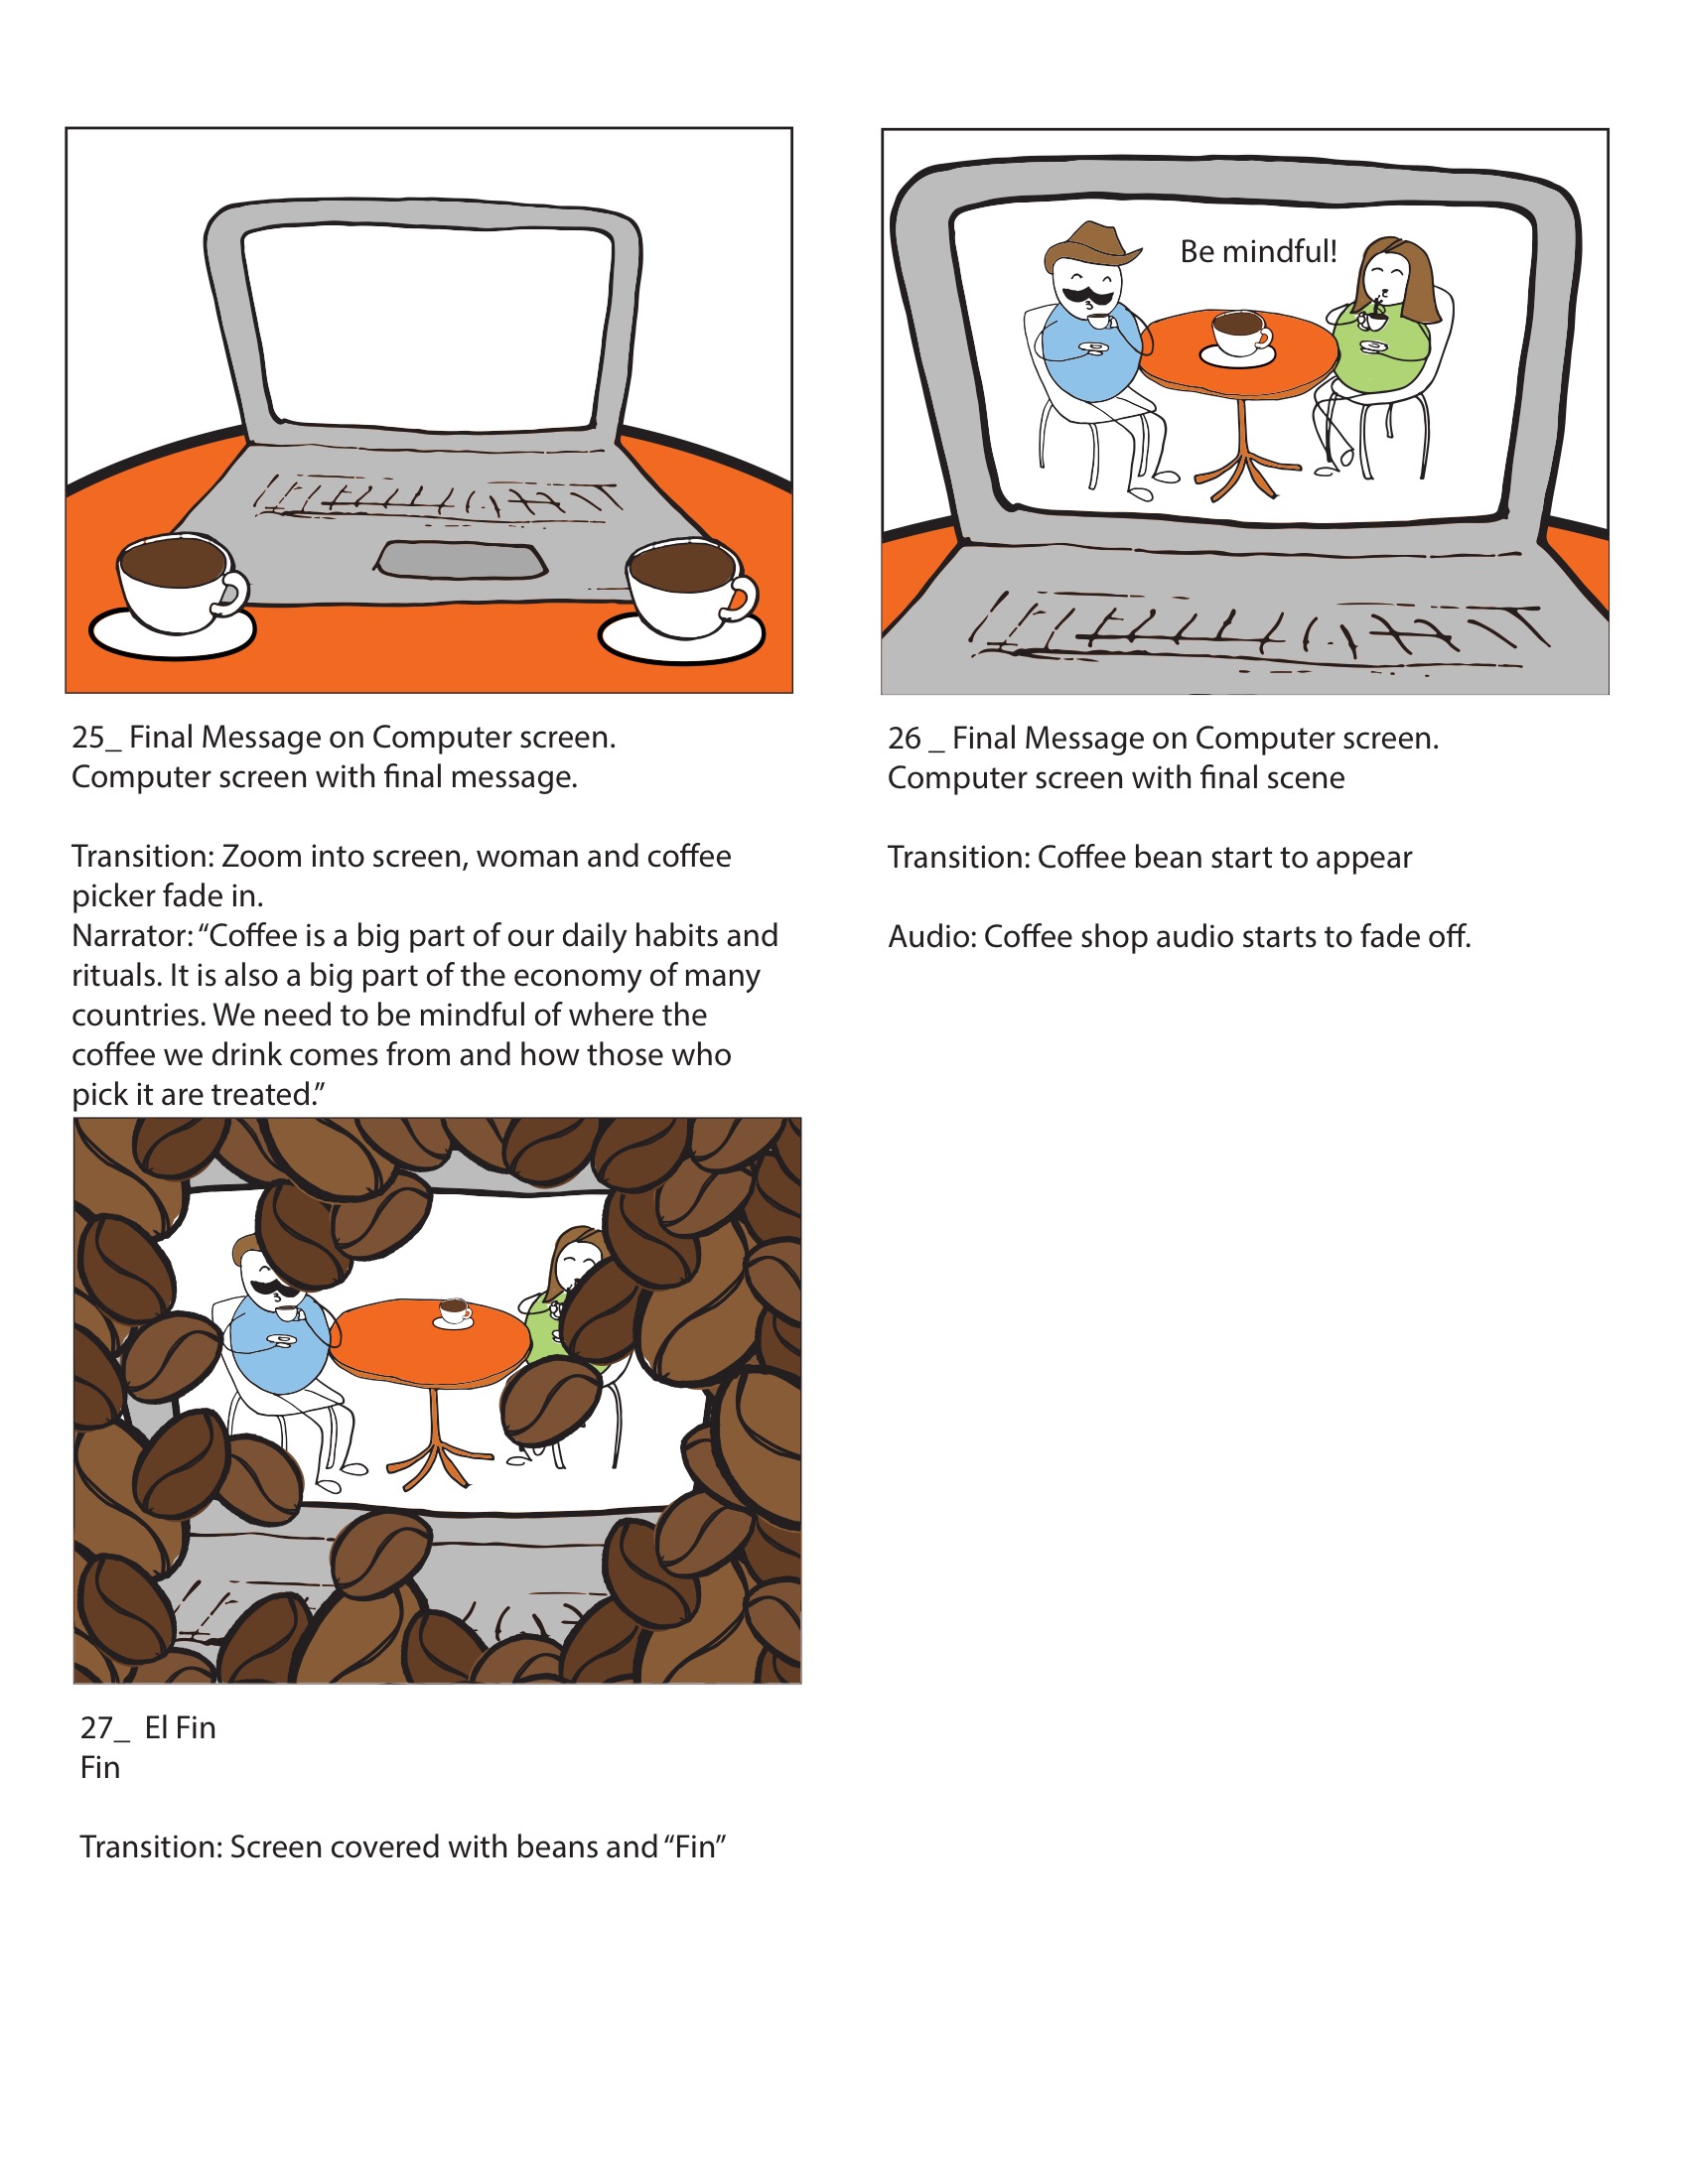
Sometimes graphics are enough to transmit a message, but sometimes projects require a little bit more.

